
Quick Start Guide
Follow these steps to start your journey by interfacing with the Rendered.ai web interface to create an account, configure a graph, run a job, and download the resulting dataset. After registration and signing in for the first time, users will be taken to the Landing page. The Landing page is where you can view recent work across organizations and drill down into the the Organization-specific data quickly.
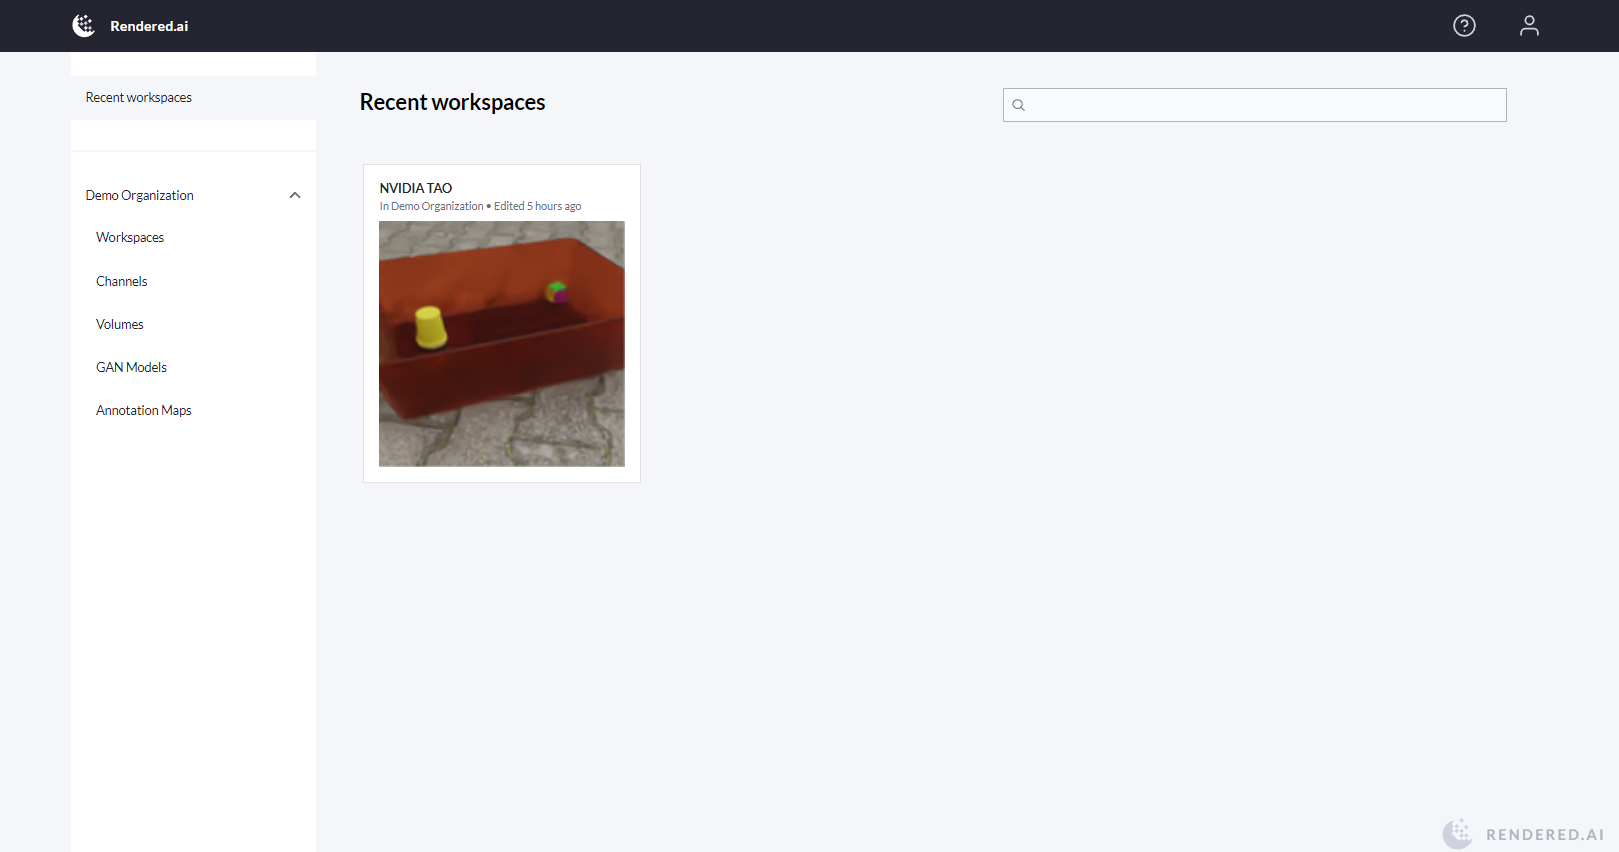
Landing Page
Clicking on the drop-down icon next to our organization will give us quick access to the Workspaces, Channels, Volumes, GAN Models and Annotation Maps that the organization has access to.
Setting up your Organization
New accounts with Rendered.ai will want to customize their Organization. The Organization is where all workspaces will be housed and where all members from your business will be able to share their work, contribute to channels, and generate new datasets. Initially the organization is named after the name of the user it was created for, to edit this name we will go to the Organization Setting page. We can get there one of two ways, the first is by clicking on the Organization name on the left hand side of the screen then clicking on the Settings button.
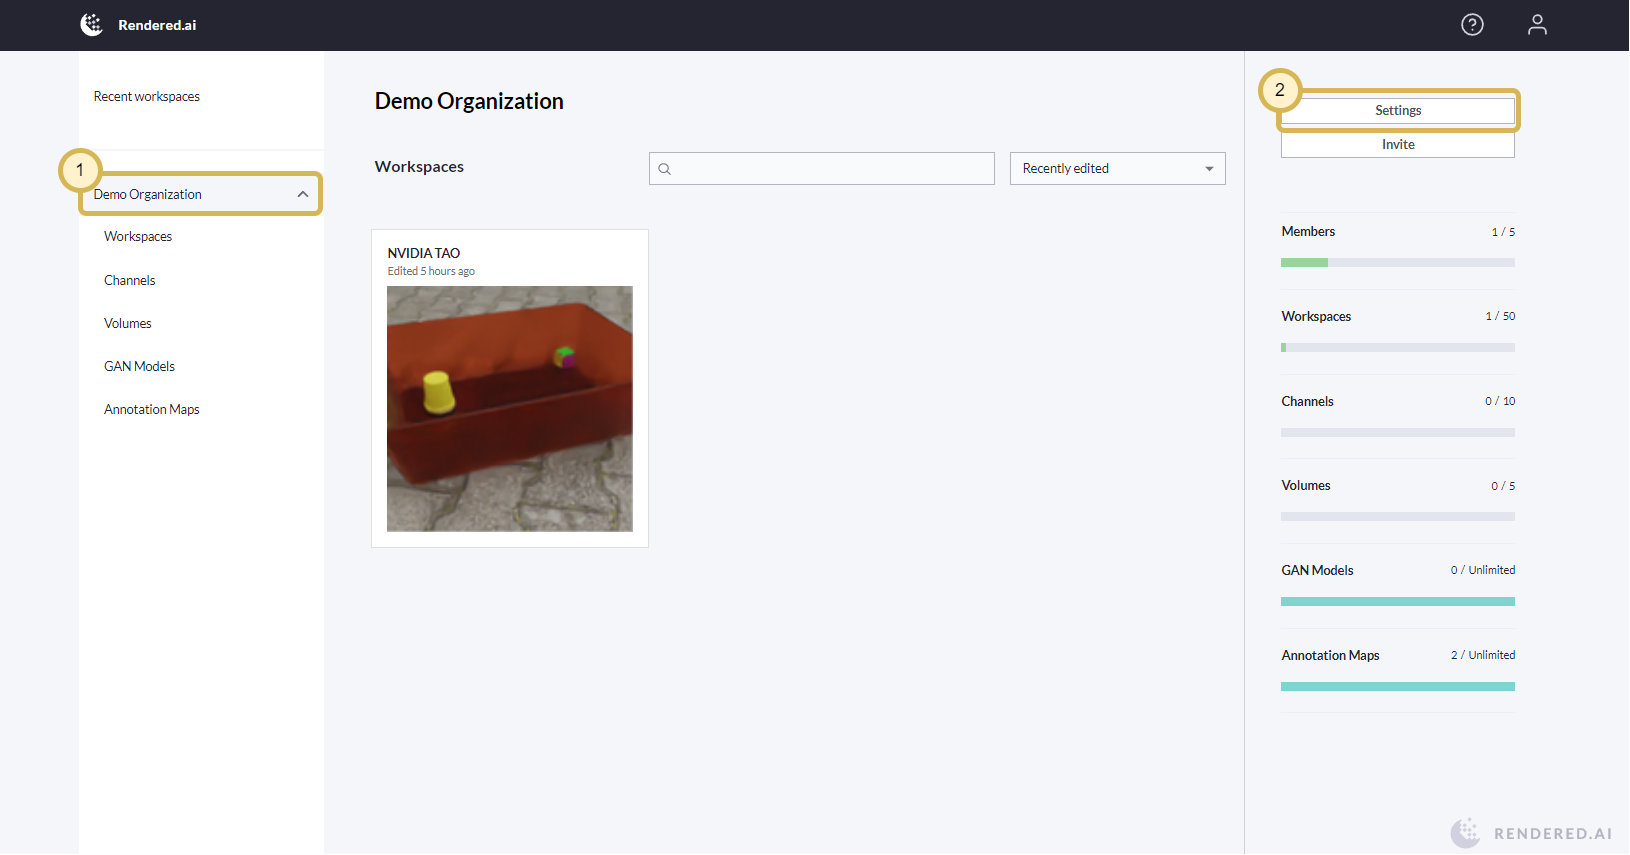
Landing Page Organization Settings
The second method is to click on the User Icon in the top-right, and click on the Organizations from the drop-down list.
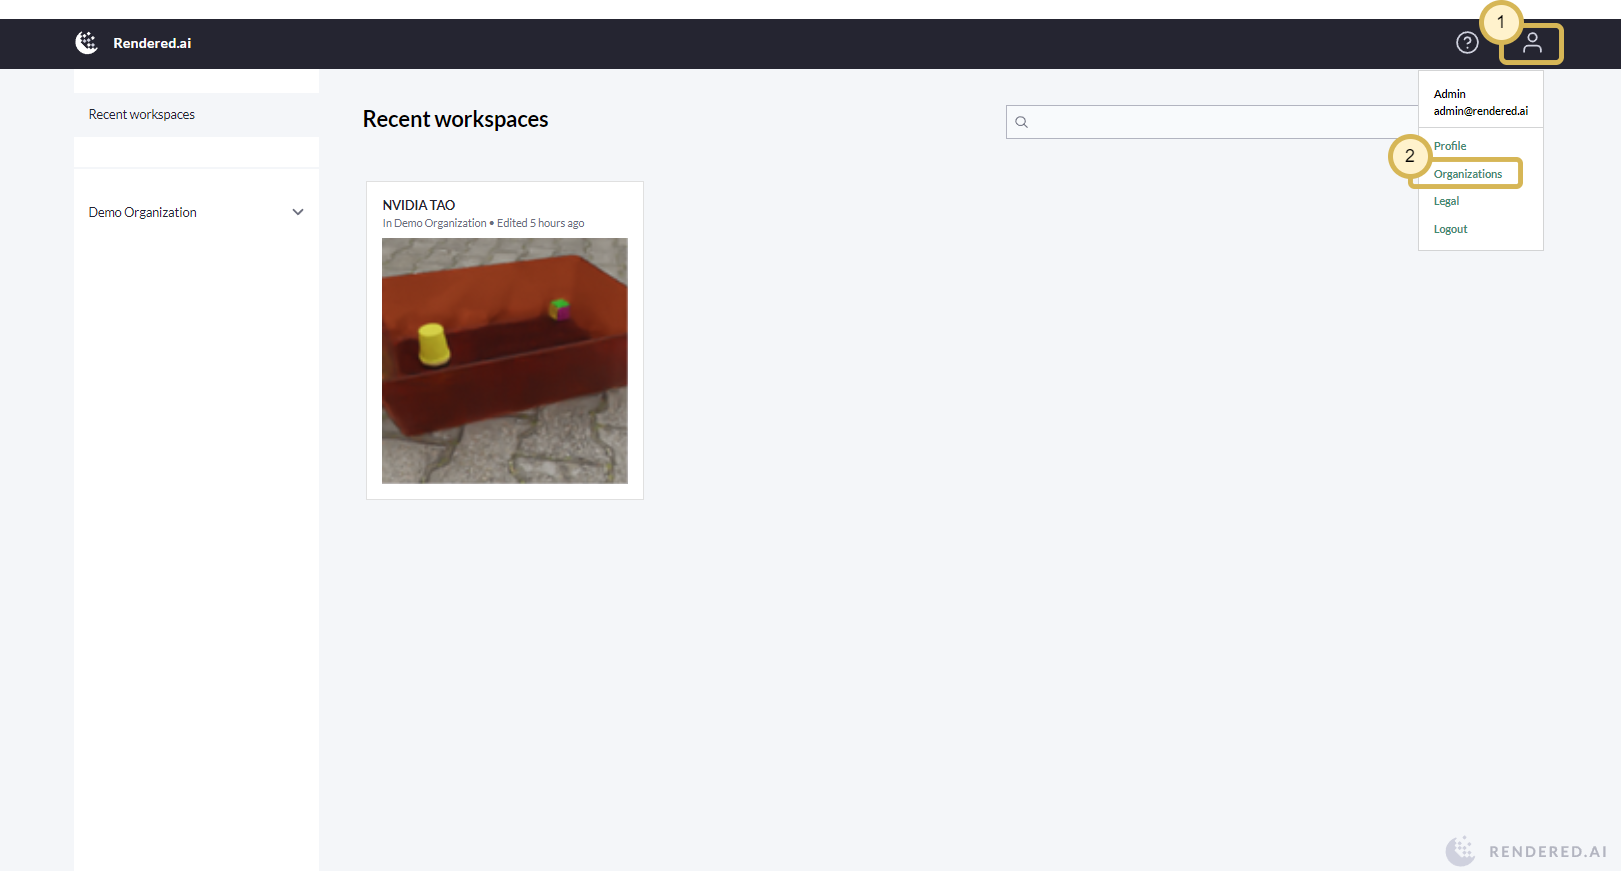
User Organizations
The Organization Settings page has information about the organization: the name, organization ID and plan. It also contains information about limitations put on the organization and any workspace within the organization. We will edit our organization name by clicking on the pencil icon next to our organization name, entering the new name and clicking Save.
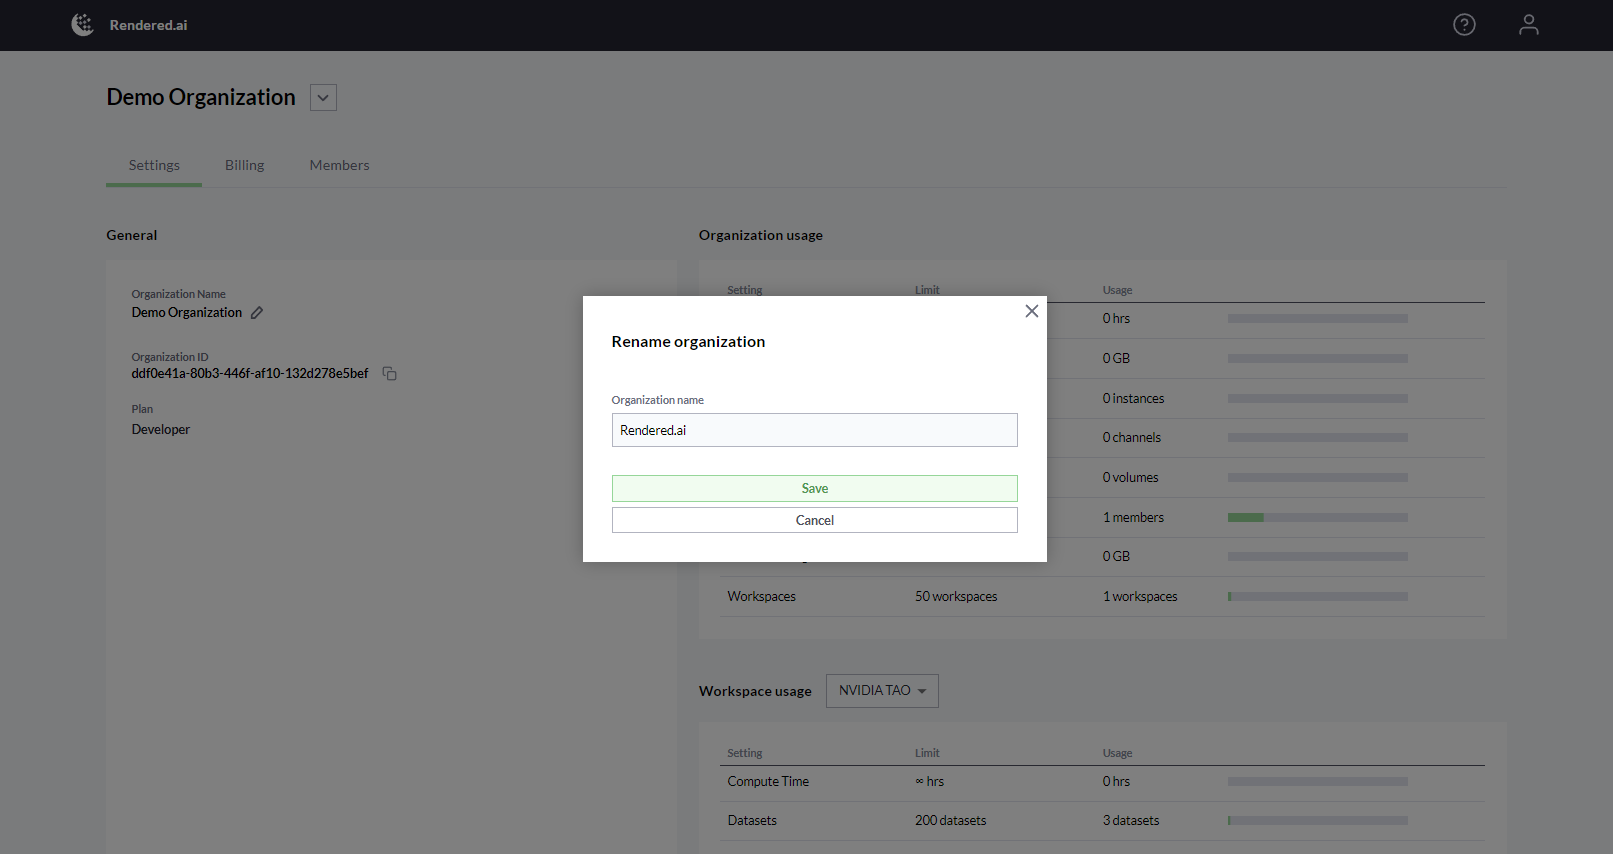
Editing the Organization Name
Now that we’ve customized our organization name, lets take a look at what you can do within the organization.
Workspaces
Every new organization that is created within Rendered.ai is given a workspace. The workspace in your organization will depend on if you entered a Content Code during the registration process or not. A workspace is a place to create graphs and generate datasets which may be shared within or outside your organization. You can create a new workspace by selecting the organization, Workspaces and clicking the green New Workspace button in the upper right of the screen.
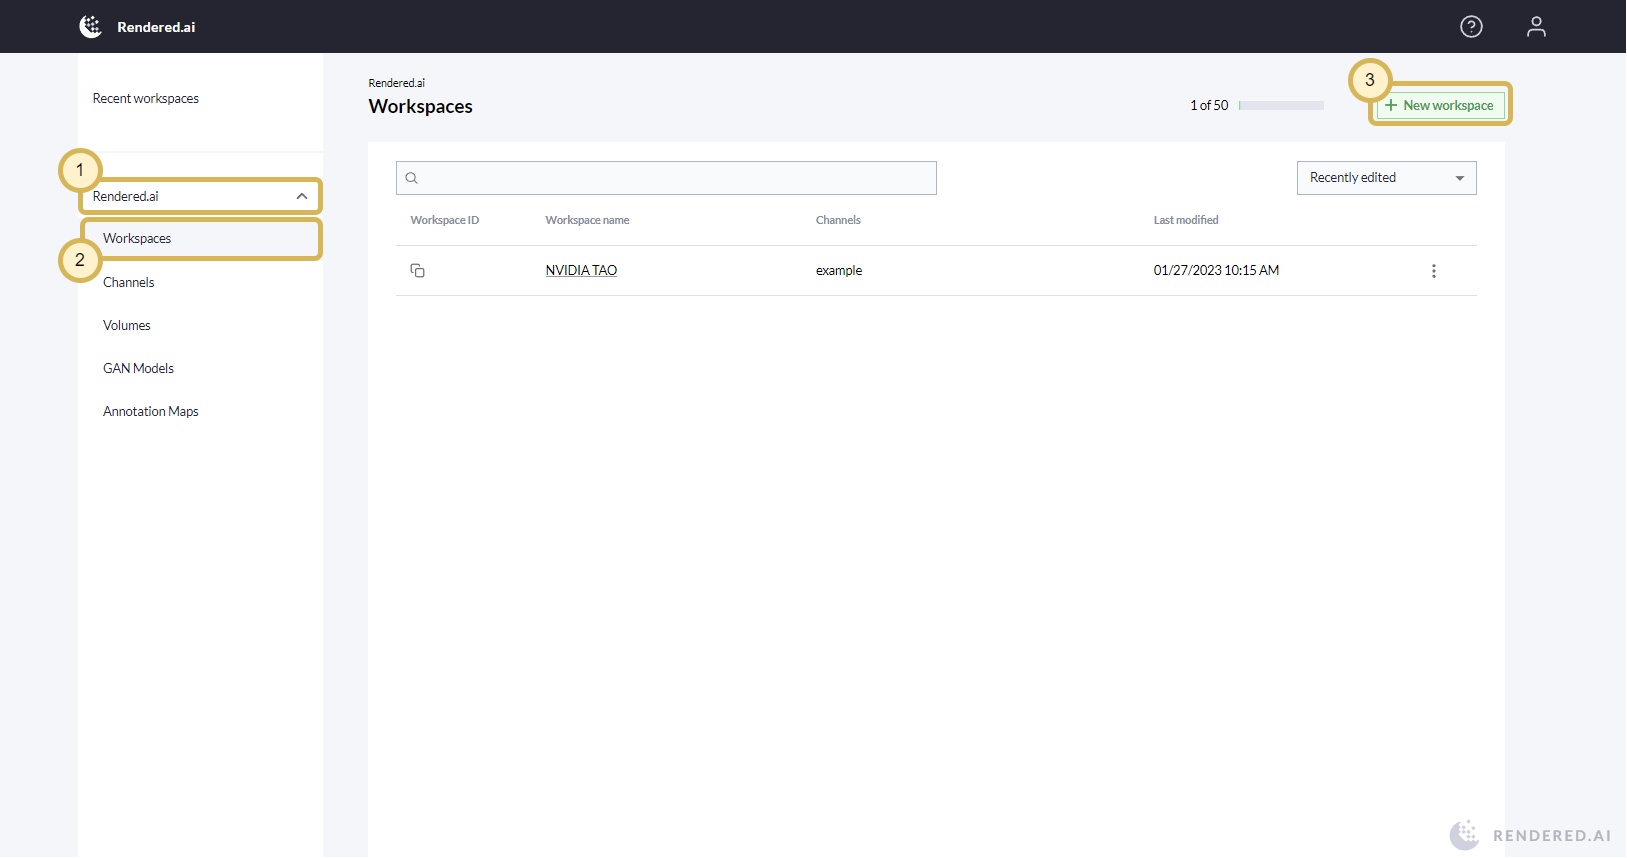
New Workspace Button
For this new workspace, we are going to name it Example and add the example channel to it. You could optionally specify a Content Code which could include additional data. To learn more about Content Codes, see our application user guide on Content Codes.
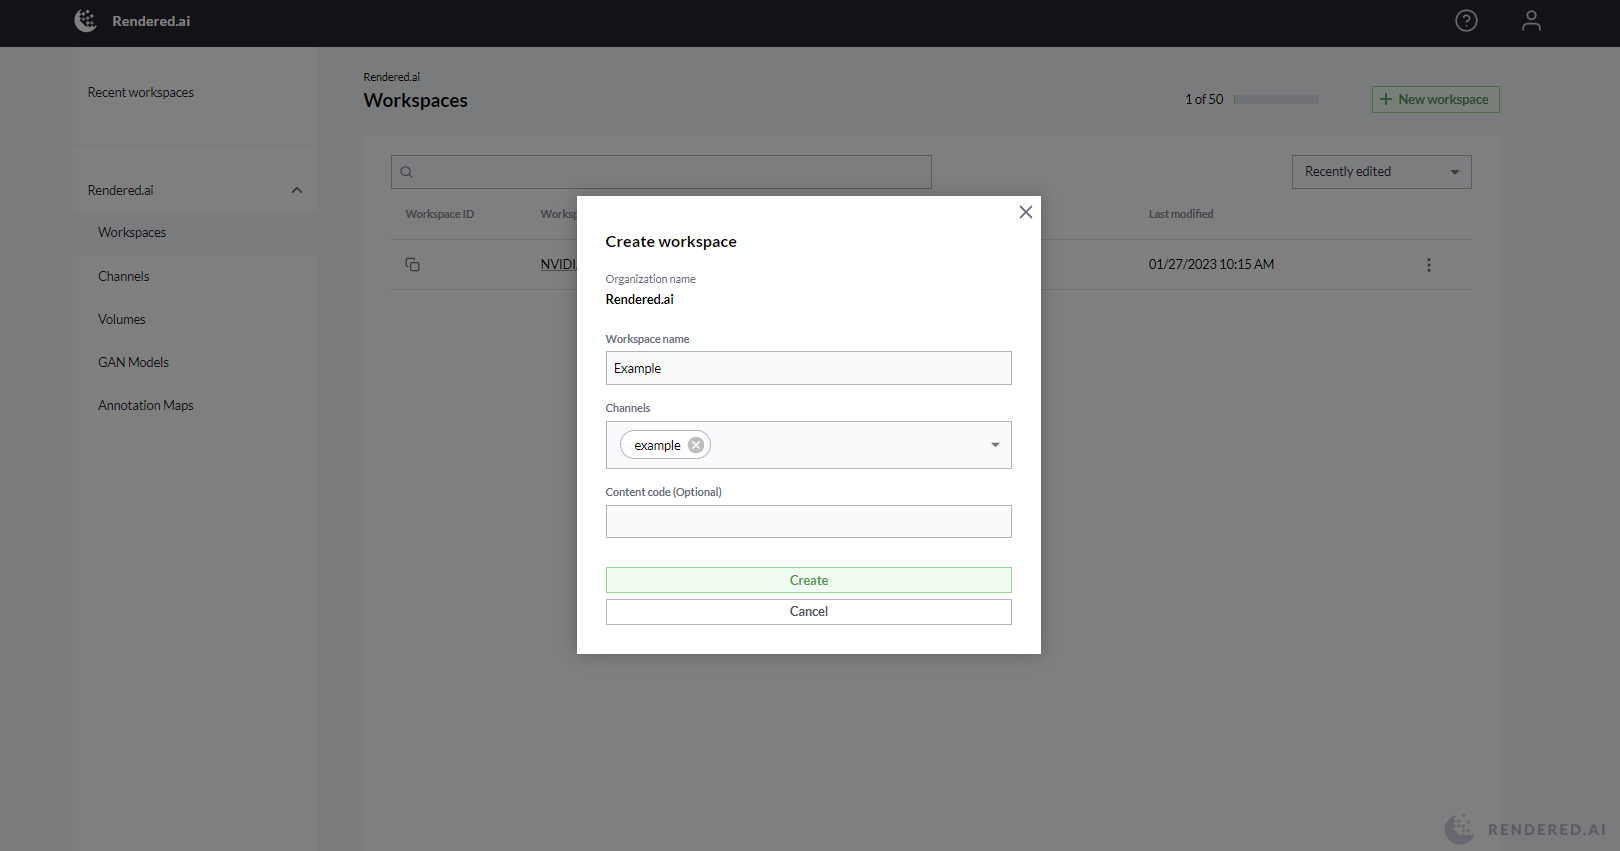
Creating a Workspace
For this workspace we have selected Rendered.ai’s Example channel. Channels define the simulation architecture (3D objects, backgrounds, sensors, sensor platforms, etc.) required to generate synthetic data. The Rendered.ai Example channel serves as a generic channel (toys generated in a box) that allows you to experiment and learn the platform. This channel corresponds to the public codebase on Github: https://github.com/Rendered-ai/example. New organizations are provided with the Example channel. Rendered.ai develops a number of other channels for various applications that are available on request. Channel customizations can be made directly to a cloned version of the Example codebase (see Ana Software Architecture), or provided as an Engineering service by Rendered.ai .
After creating the workspace, we can go into the workspace to generate synthetic data. Initially the workspace will be empty and look like the screenshot below. We will need to create a graph before we can generate the synthetic data.
Empty Workspace
Graphs within a Workspace
A graph is a visual diagram that is based on a channel’s codebase, allowing you to view the objects and connections that exist in that channel, modify them within the diagram view, and stage the modified channel to produce simulation sets. Within the workspace view, create a new graph by clicking the New Graph button on the left-hand side of the screen.
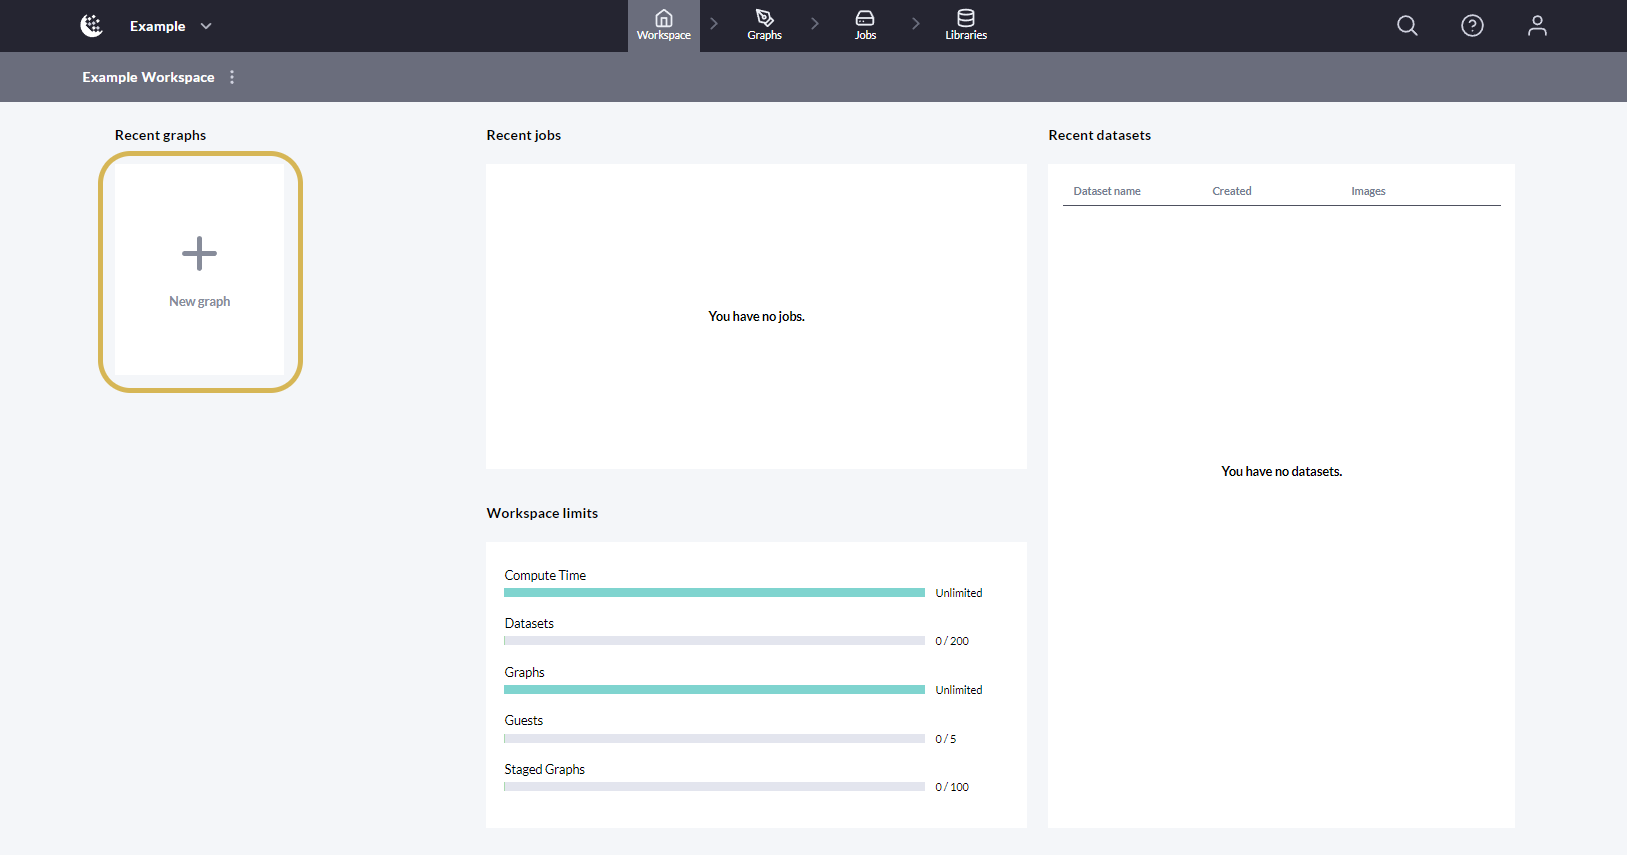
New Graph Button
Provide a graph name, channel and optionally a description for the graph then click Create. We can also optionally upload a JSON or YAML representation of a graph that will place nodes and links for us rather than a default graph.
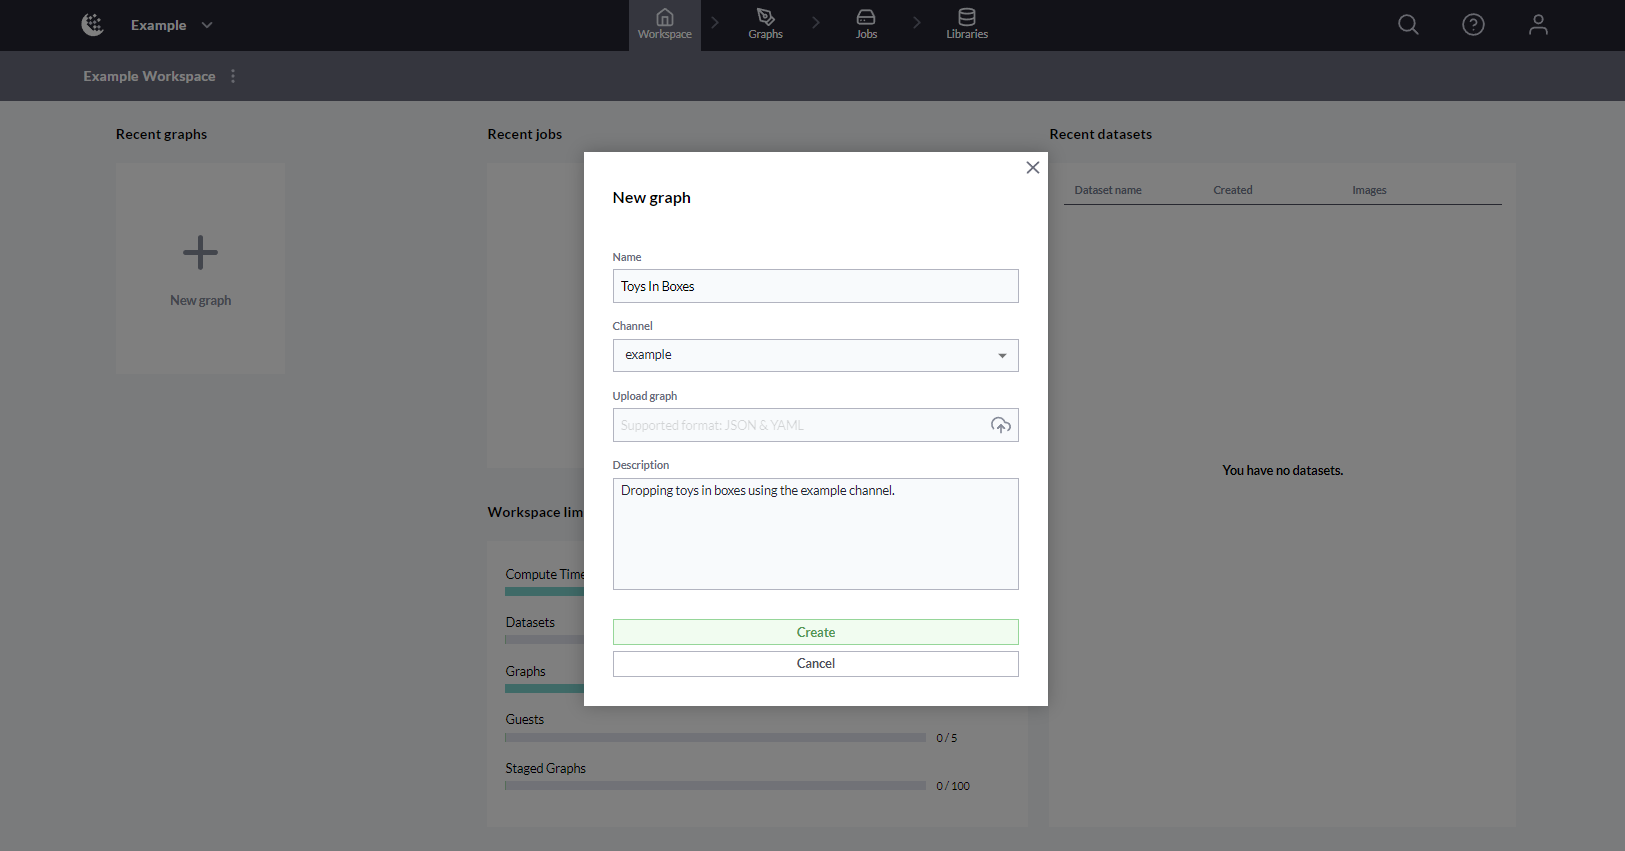
Creating a Graph
Once created, the graph can be viewed as a node-edge diagram in the graph viewer. You can learn more about Creating and Using Graphs and Graph Best Practices by following these links.
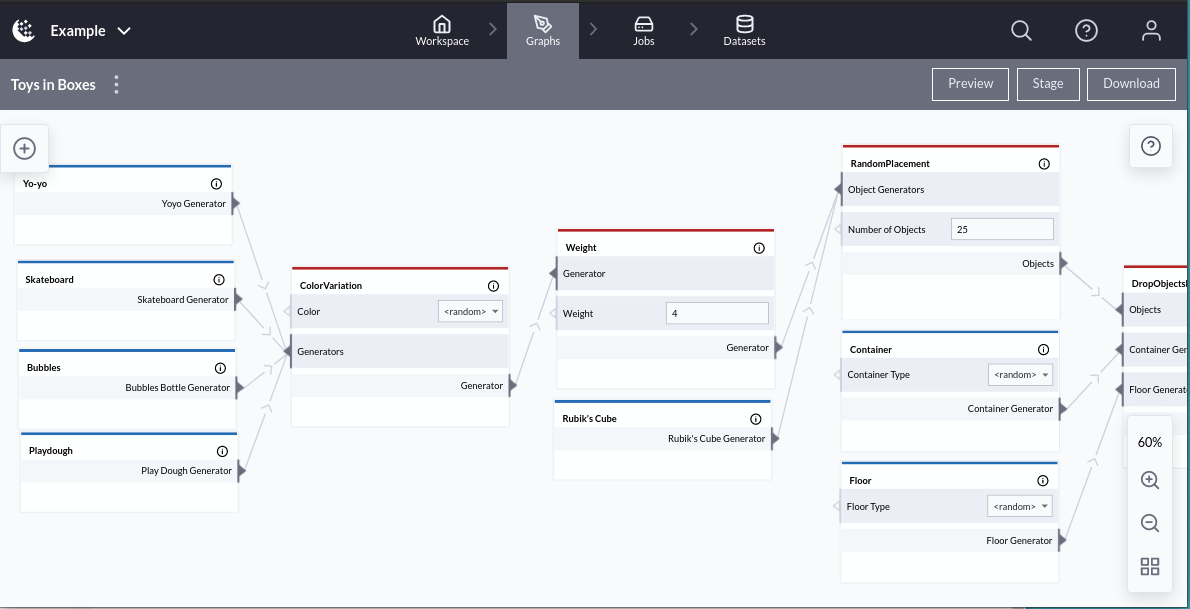
Toys In Boxes Graph
Clicking the Preview button in the top right of the screen renders a sample image of the provided graph configuration, allowing you to ensure your requirements are met before staging the graph for production.
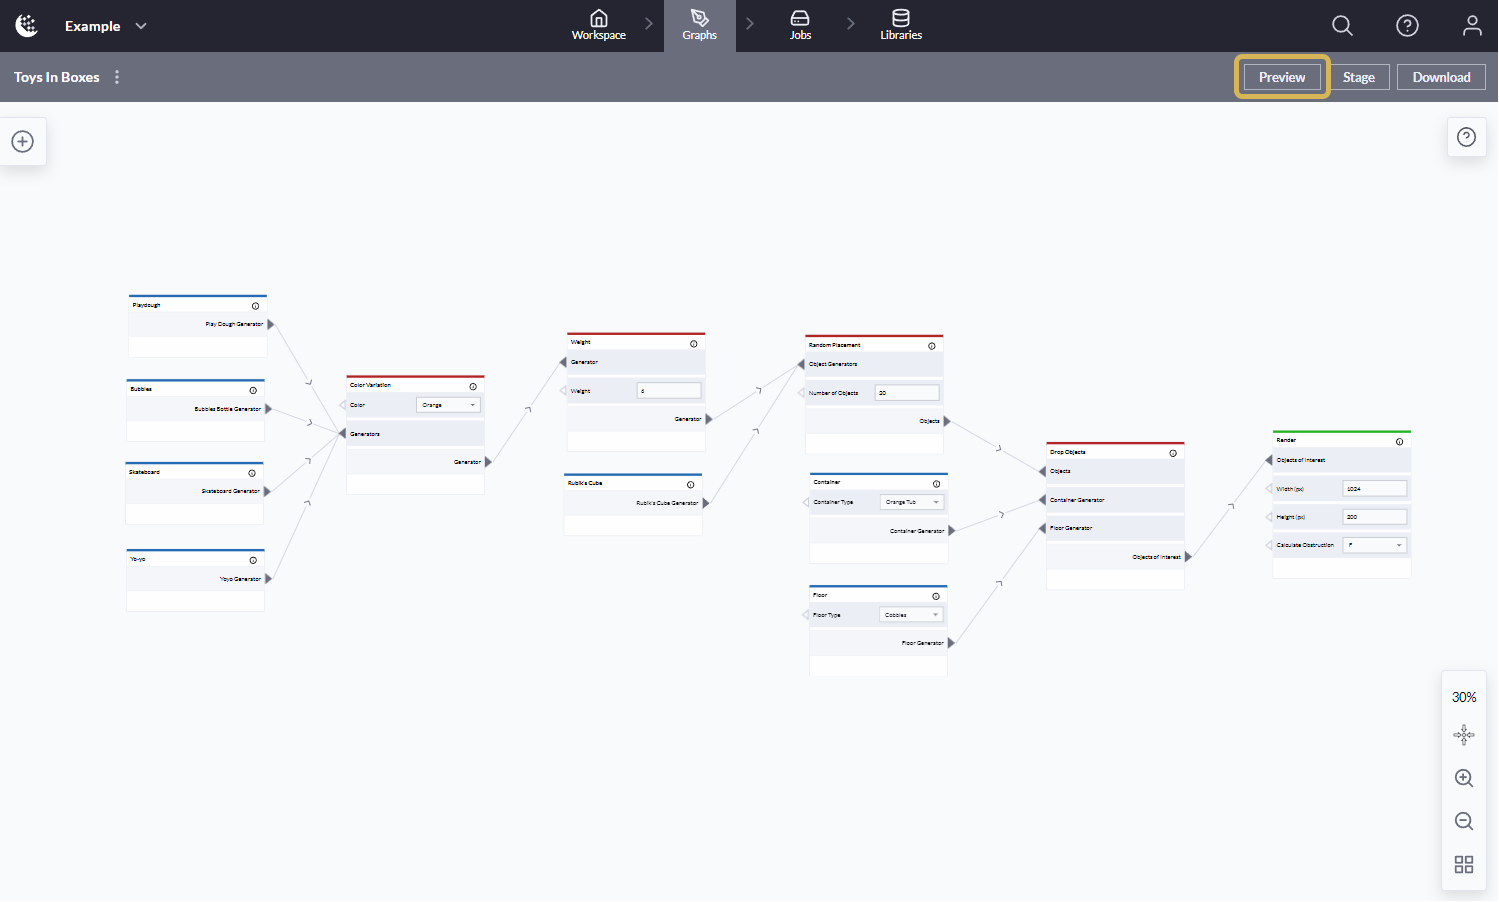
Preview Button
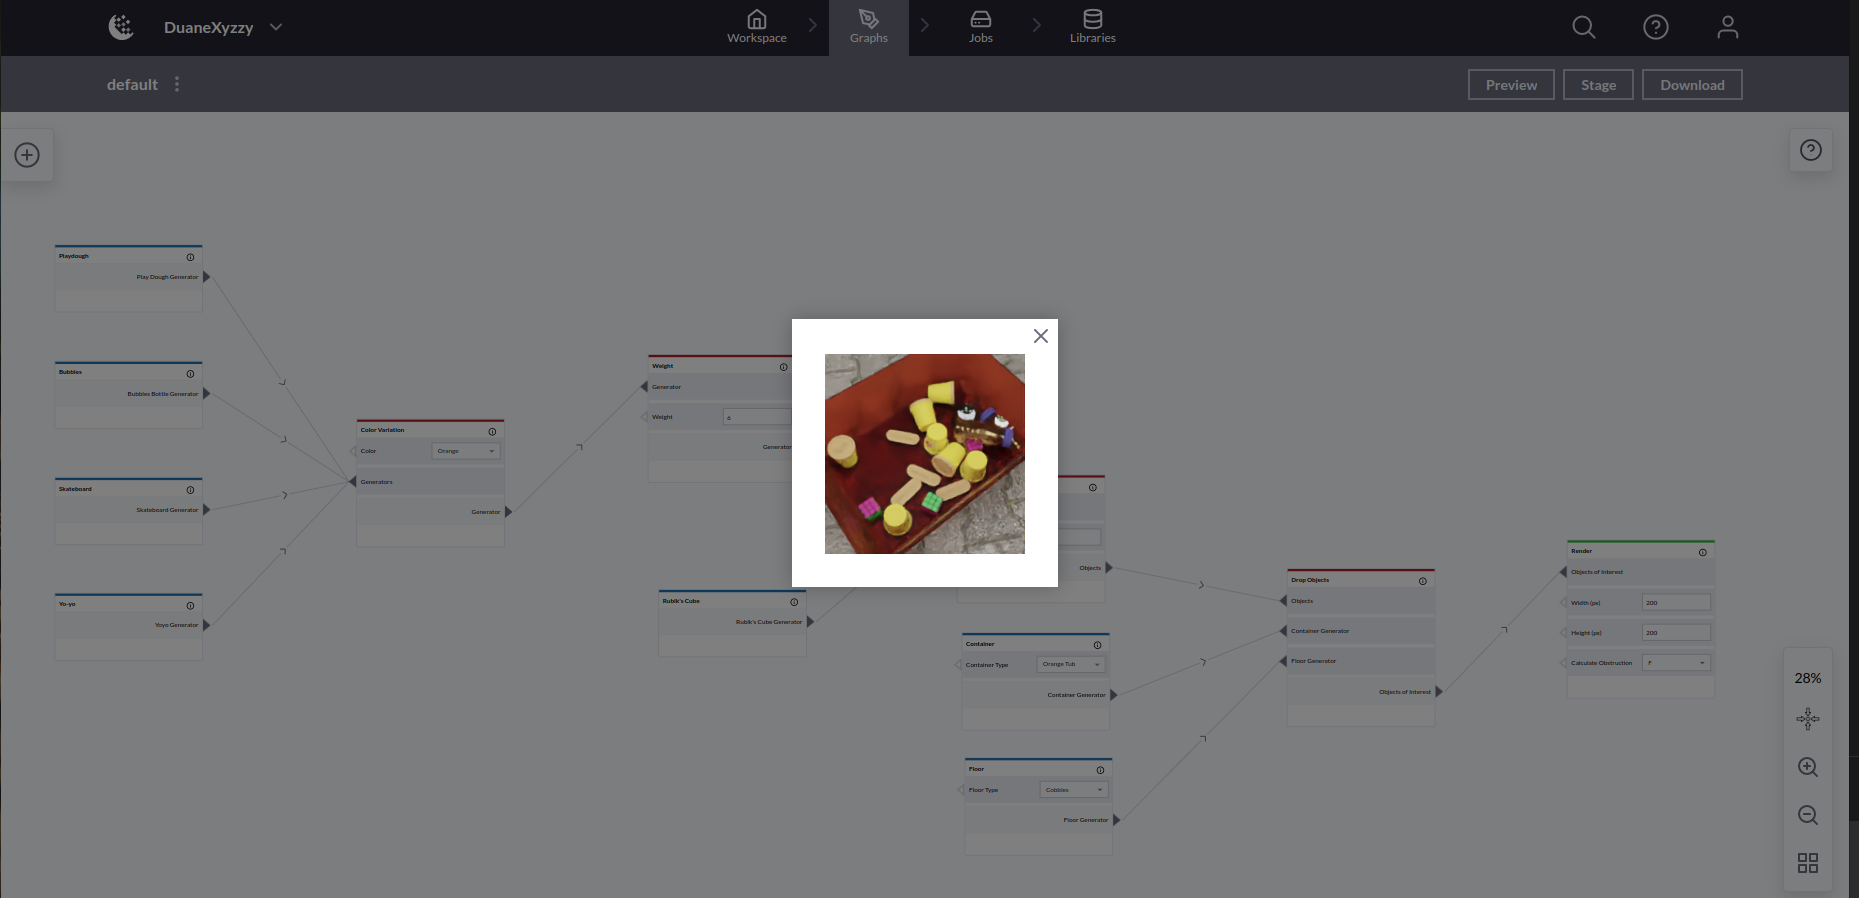
The below is an image generated during preview of the default graph on the example channel.
Staging Graphs within the Jobs Manager
Once the graph is providing a satisfactory output, it can be staged by clicking the Stage button on the top right of the screen.
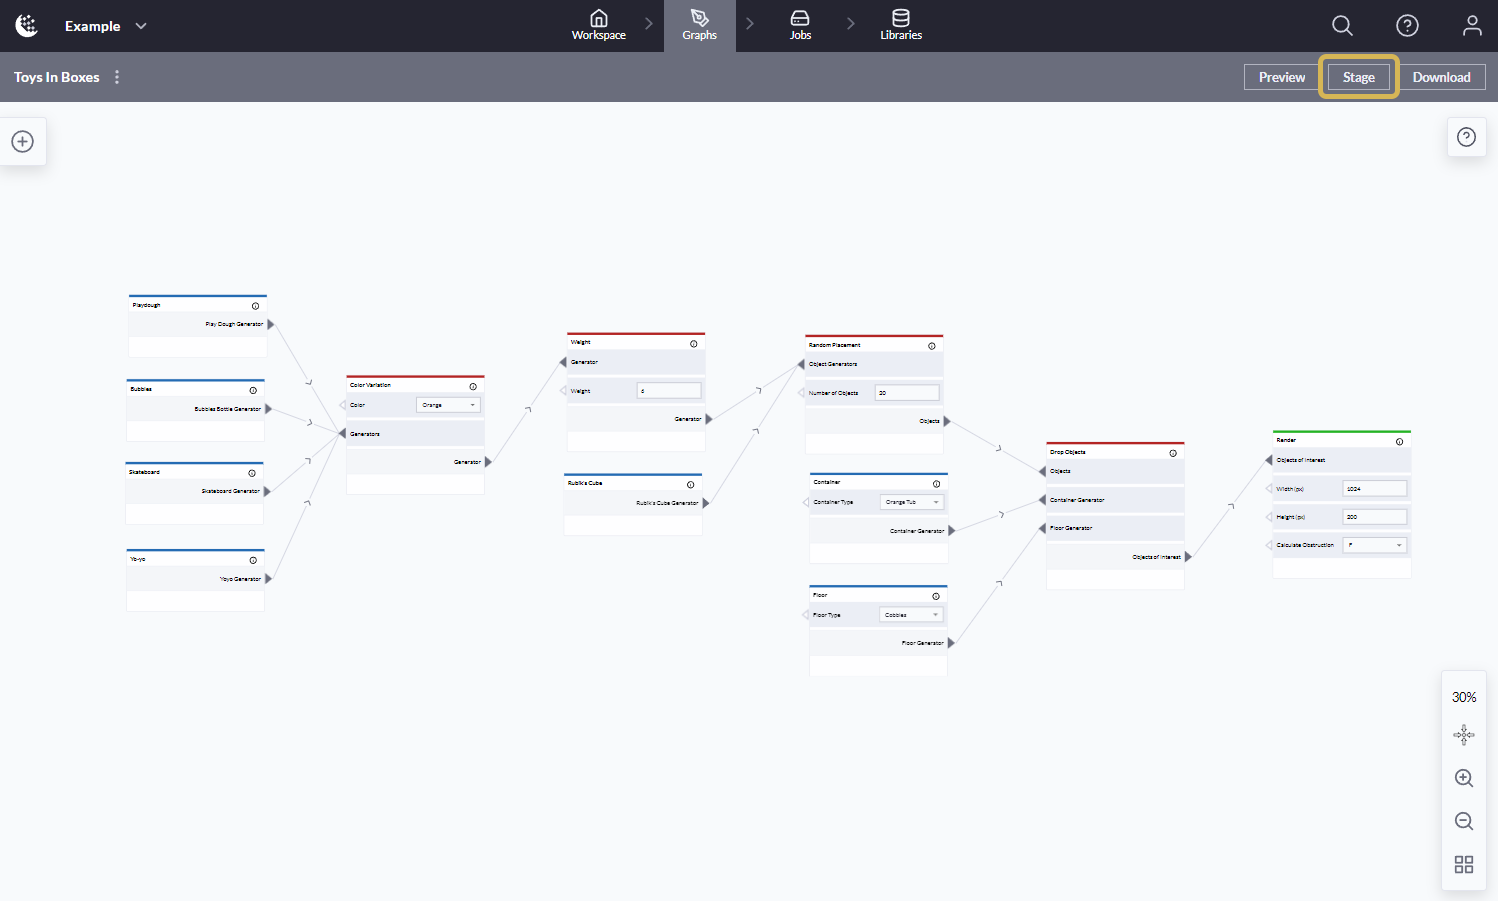
Stage Button
Staging a graph adds an item to the Staged Graphs section of the job manager.
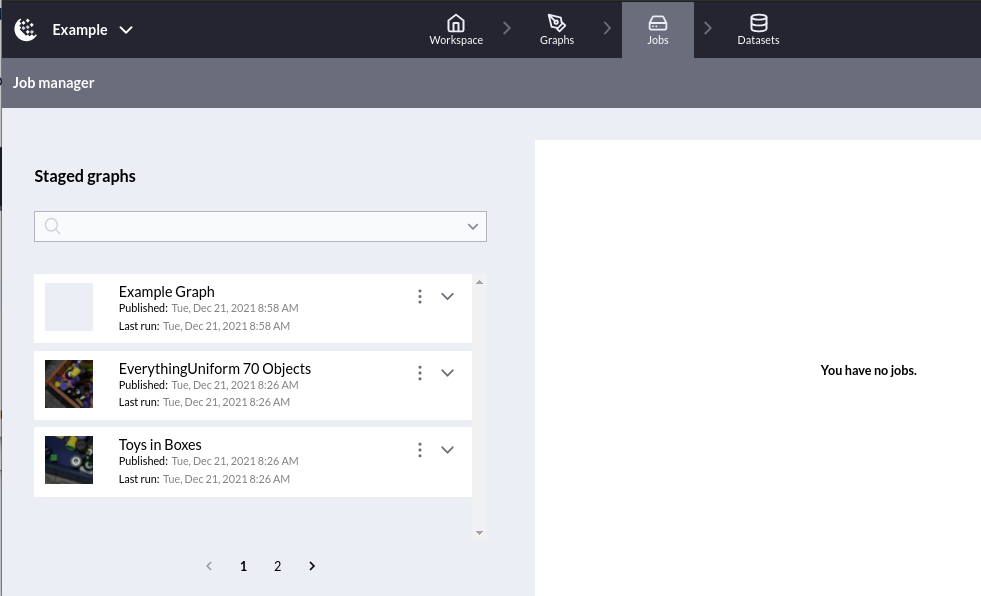
Staged Graph section of Jobs page
When configuring a dataset job, a name and description can be given to the output dataset, and you can specify the number of images to generate, as well as a specific seed to initialize the random number generators in order to match results across multiple runs if desired. You can also designate priority for the job if multiple jobs are being run at once. Clicking the Run button will launch a new dataset job.
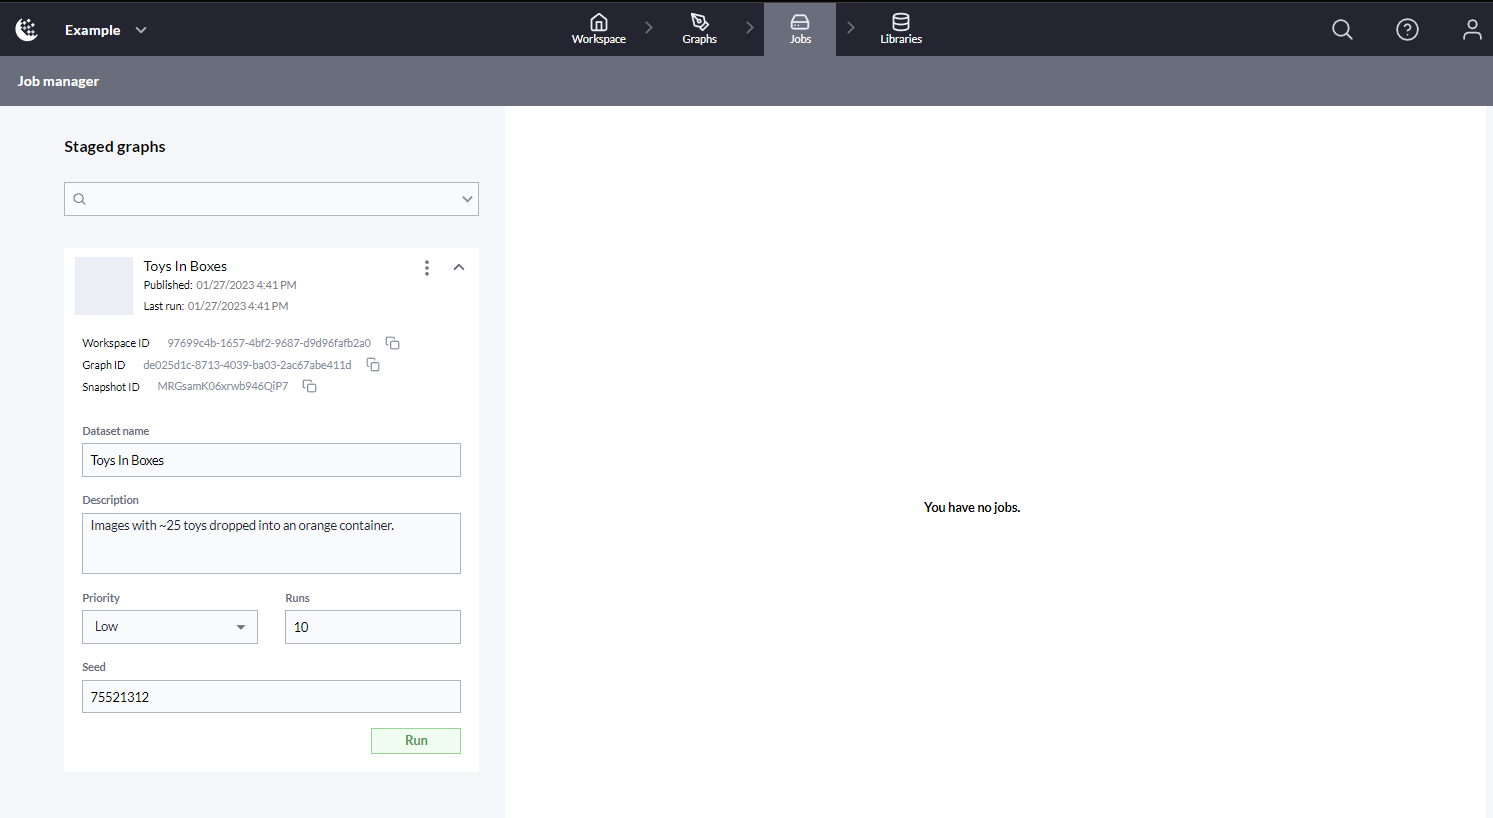
Toys In Boxes Staged Graph
Once the dataset job has started, you can view more detailed status of the job by pressing the downward-facing arrow on the right-hand side of the job.
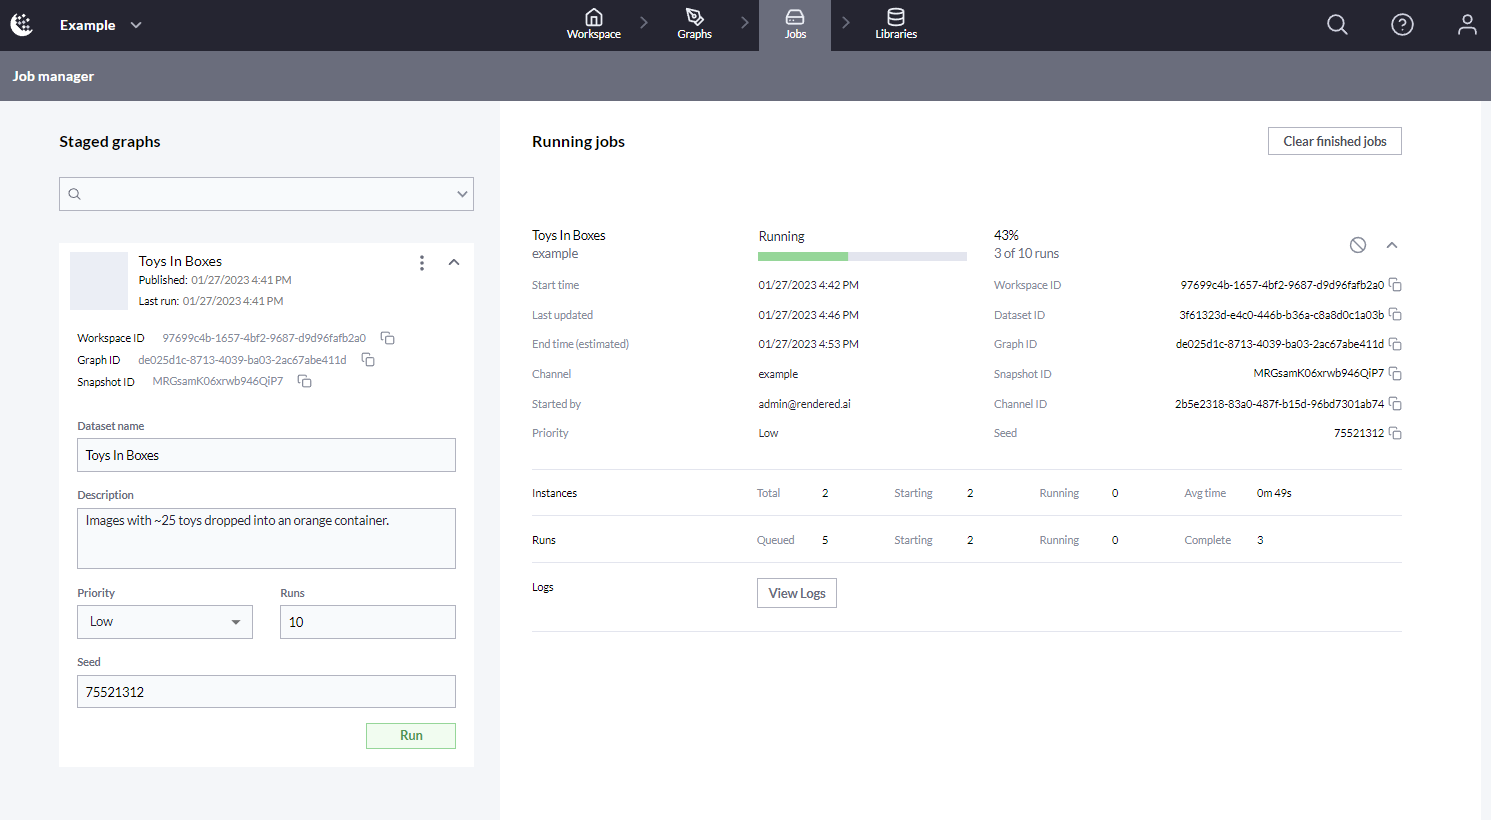
Running Dataset Job
This shows average time per image, and gives an estimated end time for the run. It also provides information about compute instances being used to process the job.
Dataset Library
Once the job is complete, you can find the dataset in the Datasets Library section of the workspace.
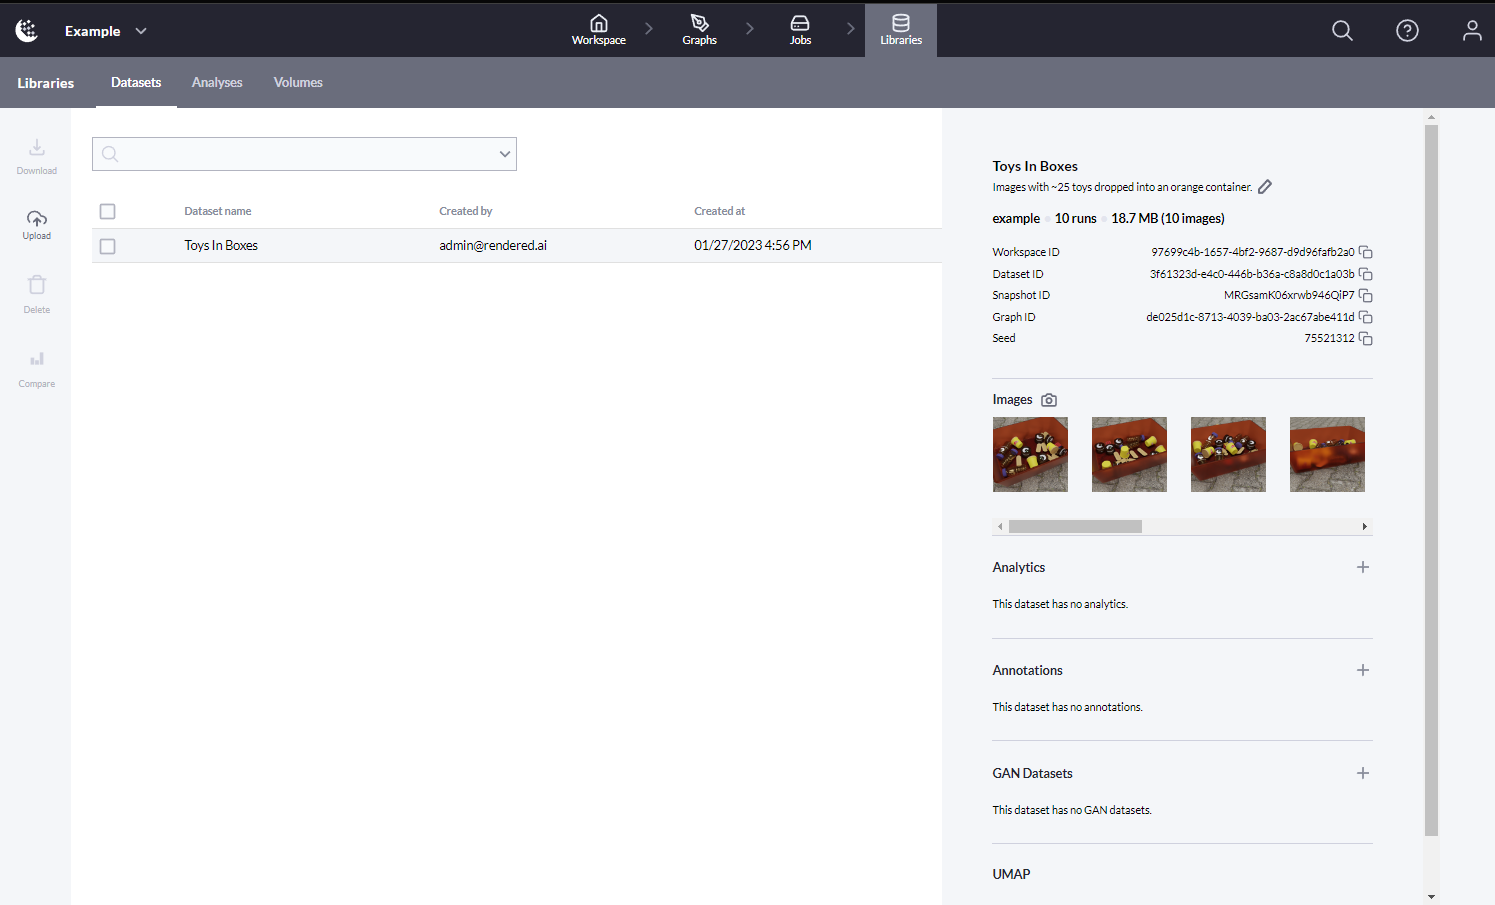
Datasets Library
From here, you can view more information about the dataset. You can download a compressed version of the dataset and begin using the outputs to train your AI. To learn more about Datasets, reference our guide Creating and Using Datasets. You can also use services to learn more about the dataset, compare datasets or generate new annotations.
Nest Steps
Now that you have set up a new workspace, staged a graph, and created a dataset, we recommend you learn about Organization and Workspace resources.