
Creating and Using Graphs
Graphs are a set of nodes and links that interconnect them, nodes can have a set of inputs and outputs. The graph can be thought of as parameters that define how a scene or objects in the scene are modified and rendered. This page describes how to create a graph, and how graphs are used to make datasets.
Create a Graph
A graph describes the processing steps necessary to generate a synthetic dataset. Graphs are stored in a workspace. To create a new graph, go to the main workspace page and click on the New Graph button. The new graph pop up will be displayed as shown below.
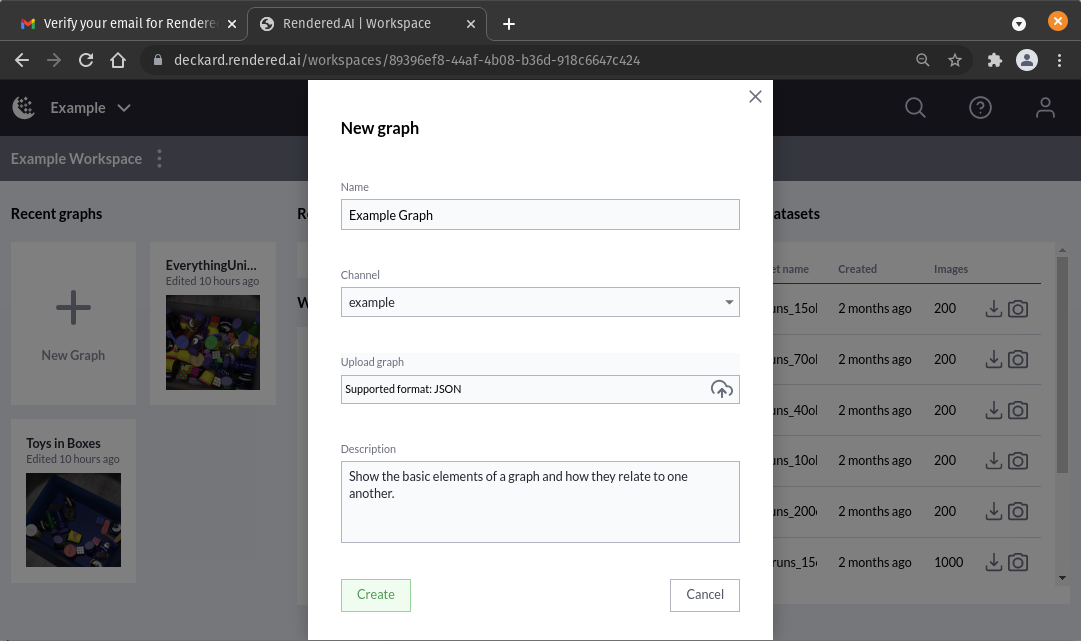
Creating a Graph from the Workspace page
Enter a name for the graph, select a channel, and enter a description of the graph. Finally, click on the Create button. A new view will be opened with the default graph for that channel in it.
Canvas View
New graph views are pre-populated with a default graph composed of a few nodes and links. This graph can be edited in the canvas and ultimately staged, or saved for use in the jobs manager.
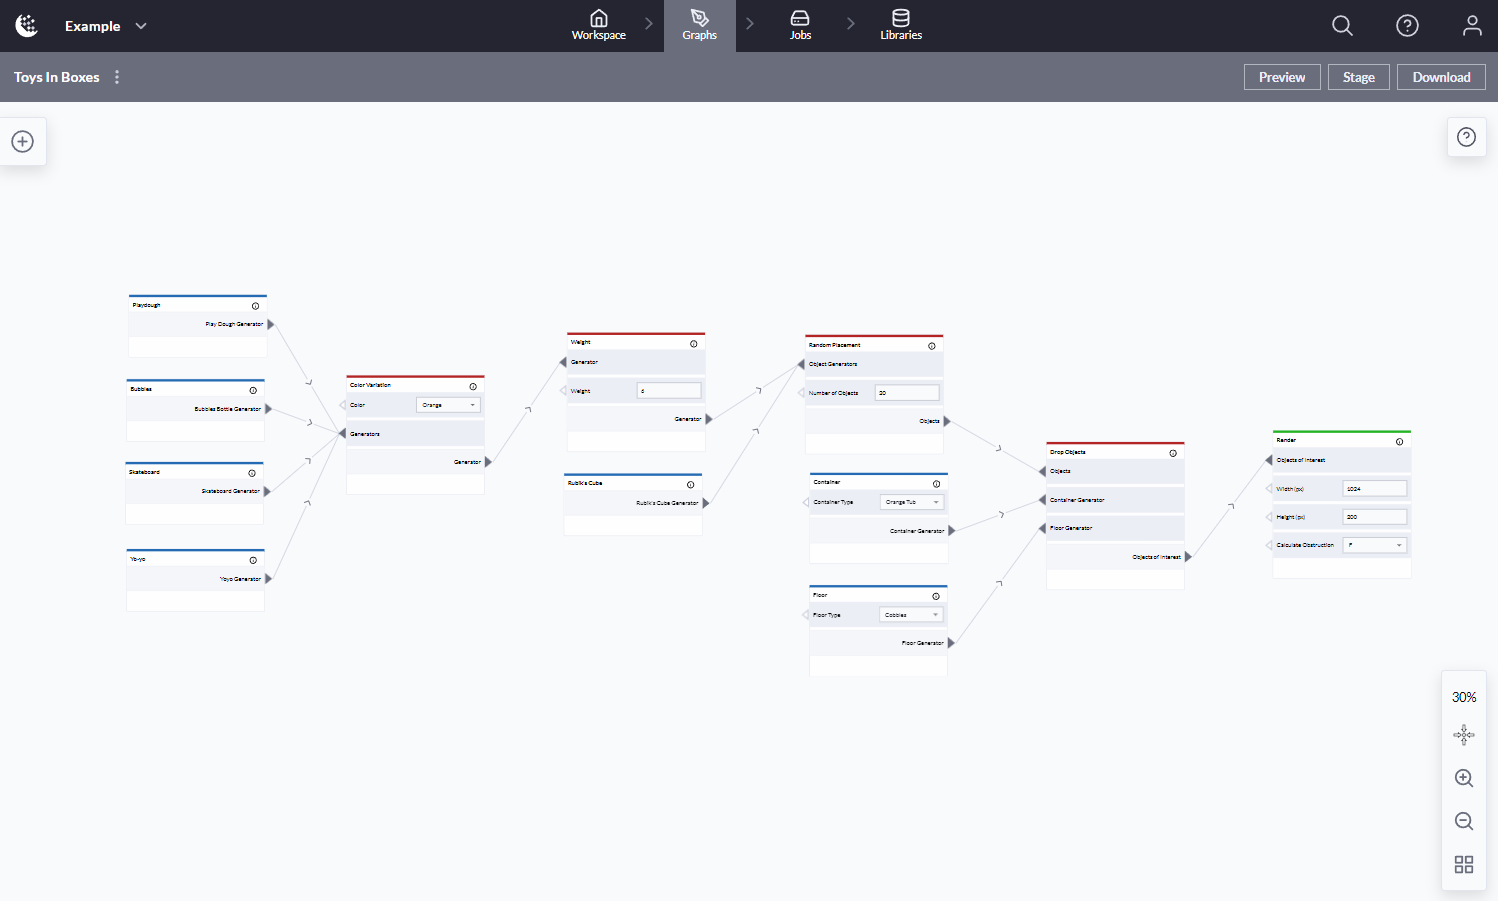
Graph view
How to use the editor
The canvas can be panned by left clicking on an open area and dragging the canvas.
The canvas can be zoomed either by holding Ctrl and using the scroll wheel or by using the buttons on the lower right in the graph editor main viewport.
Multiple nodes can be selected by holding the holding Shift while clicking the left mouse button and dragging a rectangle over the nodes of interest.
Nodes and links
Adding nodes is done from the menu of nodes which is accessed via the circled plus icon on the left portion of the screen. Also, new nodes can be created by duplicating existing nodes on the graph.
Nodes can be deleted via the trash can icon that appears when a group of nodes is selected, or by pressing Delete or Backspace.
Nodes can have inputs and outputs. Some inputs can appear as text fields or dropdown selectors, but all inputs have a port for linking a node. These links are how information is passed between processing steps. Node inputs can also be validated using a set of rules described by the channel developer in the schema, to learn more read Graph Validation .
Links are added by mouse clicking the needed input/output ports. Links are deleted by first selecting the link and either pressing Delete or Backspace.
Note that, at this time, there is no ‘Undo’ capability. To back up graphs, it’s possible to duplicate a graph by clicking on the three-dot icon on the top-left of the Graph, then selecting Save As.
Preview
Channels can implement a preview capability that allows a sample image to be generated from the current graph state. Clicking the Preview button will bring up a “Generating preview…“ message, then when the image is ready it will display the image in the middle of the graph.
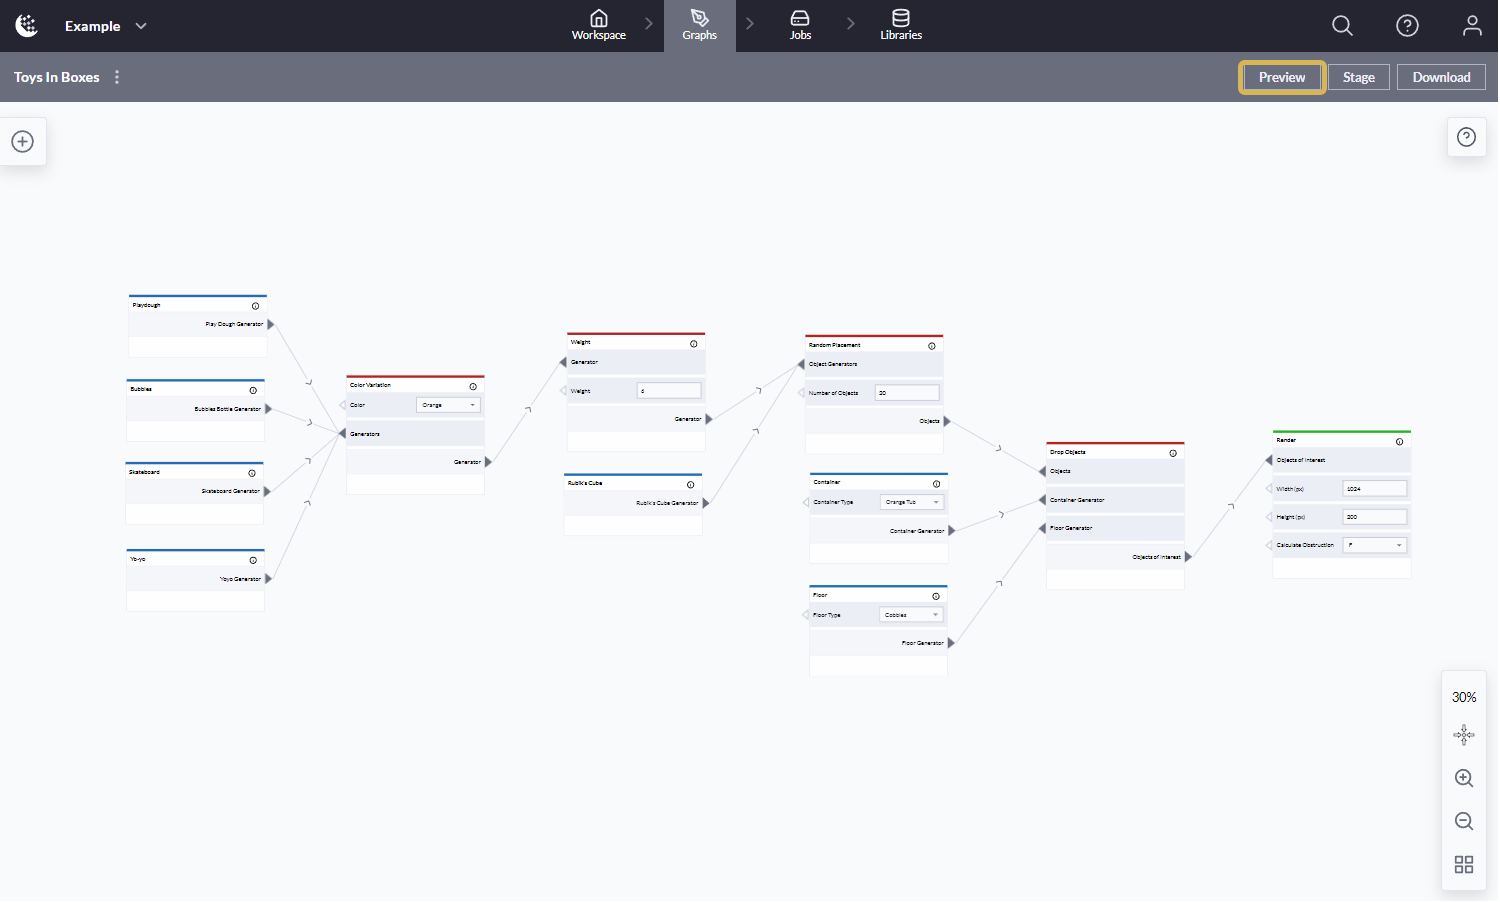
Preview button
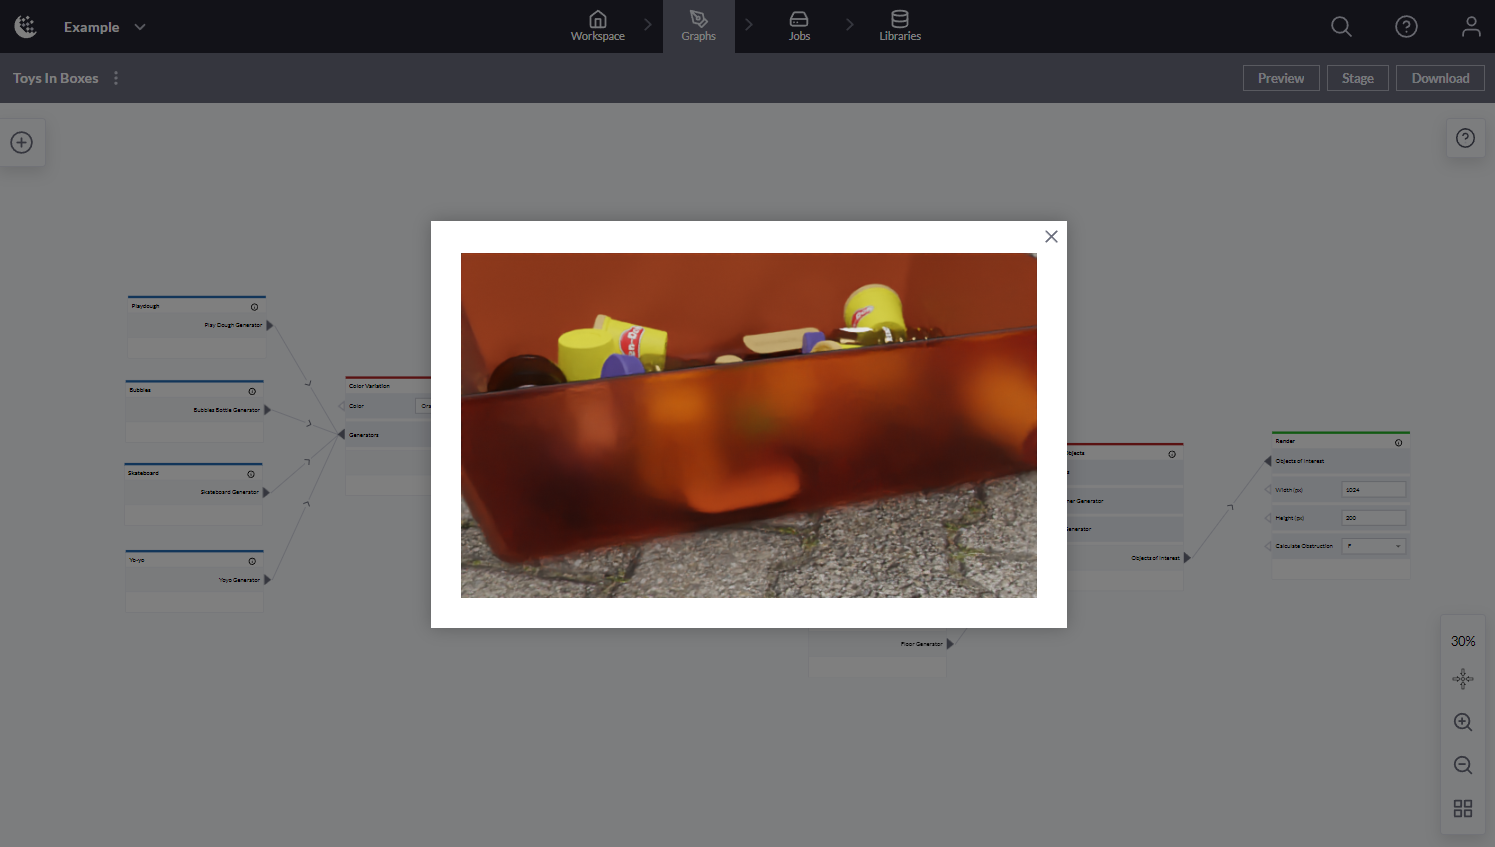
Preview Image
If the same graph is run multiple times in the workspace, preview caching will allow you to see the image right away. Preview can also be used to catch invalid graphs before staging. If a graph cannot be interpreted, the preview will result in an error message informing the user of the issue.
Staging
When you are satisfied with your graph and are ready to create a dataset, the graph needs to be staged. This will create an immutable version of the graph that can be reference later.
.png?inst-v=cf7021f4-64f7-4ca9-b661-854c336bf778)
Stage button
After clicking the Stage button, a new Staged Graph entry with the same name as the Graph will show up on the Jobs page. An example of this is captured below:

Jobs View
Once the graph is staged, a job can be run to generate a dataset. To do this, we will need to navigate to the Jobs page within the Workspace and define the parameters for the job to create a dataset.
Staged Graphs
By selecting the dropdown arrow next of the staged graph entry, the run configuration can be set.
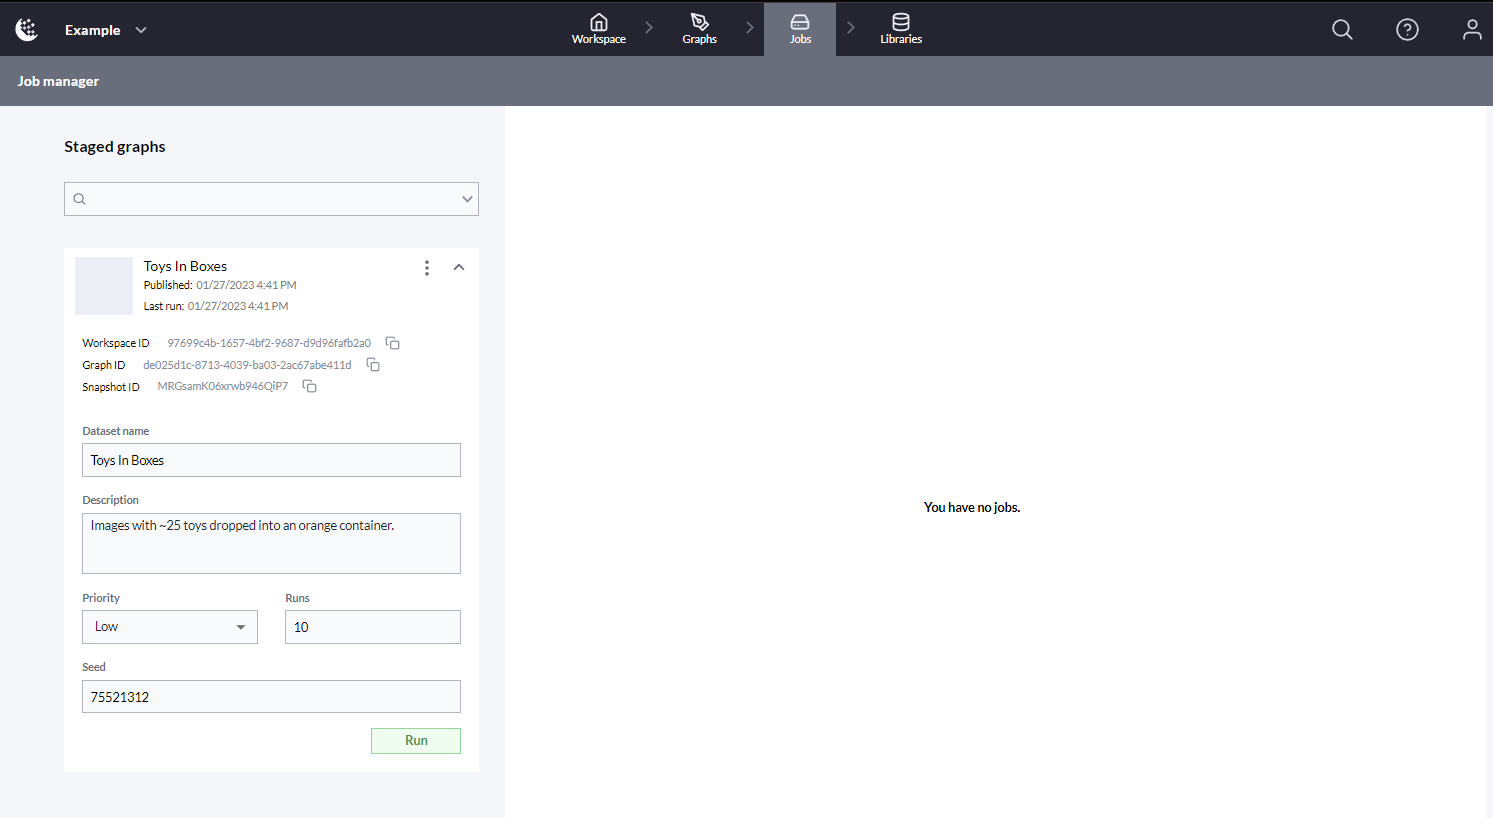
Staged Graph expanded
A description of the parameters for creating a dataset are shown below:
Parameter | Description |
|---|---|
Dataset name | The new name for the dataset, this field is prepopulated with the Staged Graph name. |
Description | A description for the dataset, this field is optional. |
Priority | Low, Medium or High. This field is used to determine when a dataset job is run for an organization. If multiple jobs are queued, the highest priority job will start first. |
Runs | The number of simulation runs used to generate synthetic dataset. This can equate to the total number of rendered images if the channel has a single sensor. |
Seed | A seed used to feed the random generator for the channel. |
Submitting Dataset Jobs
Once you have finished setting the parameters for the dataset job, pressing the Run button queues up the job.
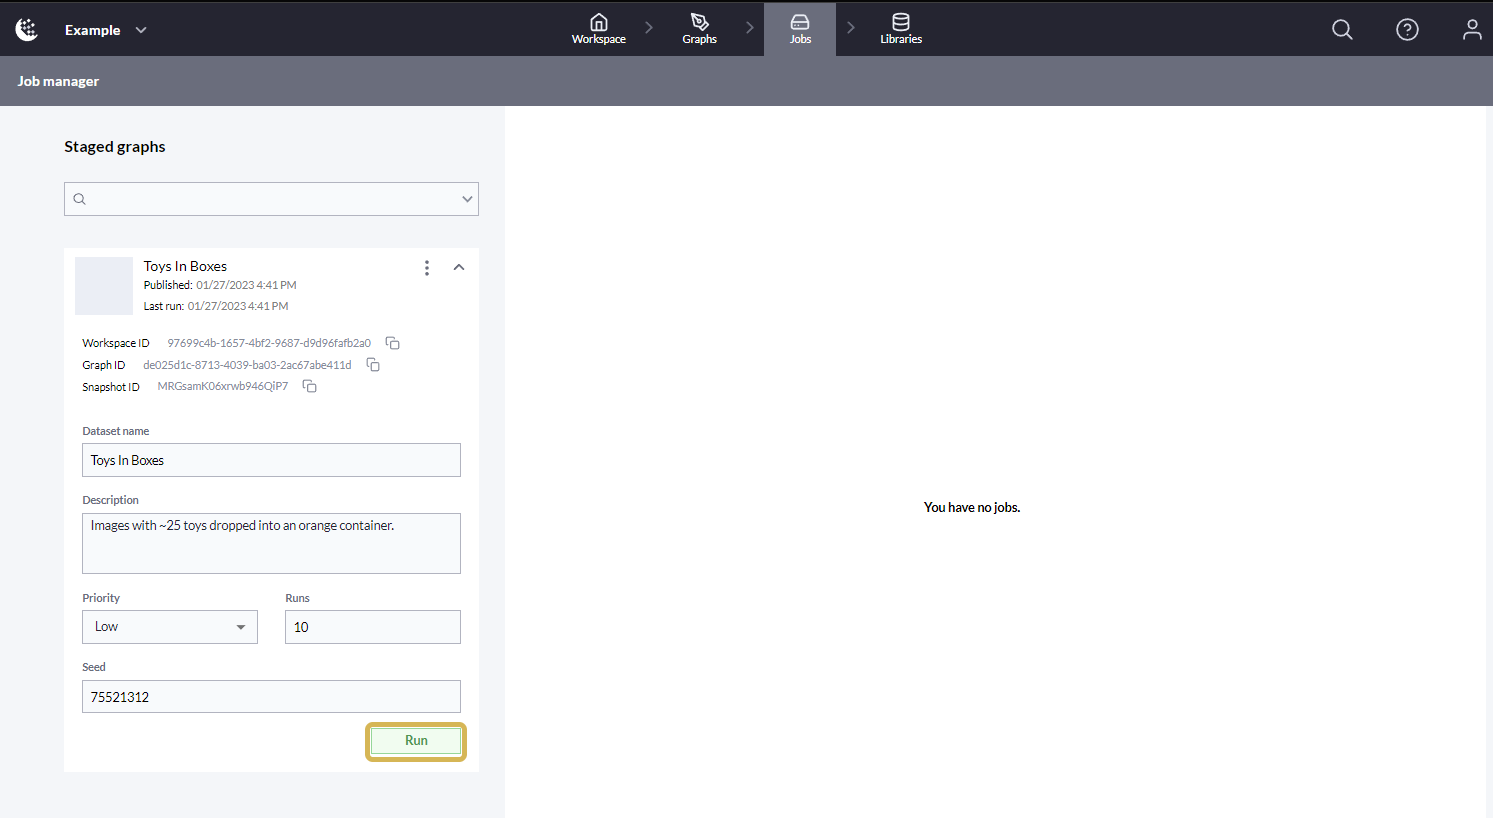
Run button
There are several states a job can be in, it is important to understand what you can do at each state.
Job Status | Description |
|---|---|
Queued | The job is ready to be executed, usually means it is waiting on compute to be available. |
Running | Compute is available and the simulations are currently running. |
Post-processing | All simulations are complete, generating thumbnails, creating a compressed dataset and updating databases. |
Complete | The dataset has been created successfully. |
Failed | The job has failed to create a dataset. This can happen for a number of reasons: configuration issues, channel issues or infrastructure / compute issues. |
Jobs that are in the running state and have completed at least one simulation run can be Stopped, it’s status will move to Post-processing meaning that the dataset will be created with just the completed runs. Jobs in Queued, Running, Post-processing state can be deleted. Jobs in Complete or Failed state can be cleared so they no longer show up in the Jobs Queue.
Stopping or Cancelling a Dataset Job
 | The stop icon in the job window will stop the job. A stopped job can still create a synthetic dataset, or be deleted using the trash icon. |
 | The trash icon in the job window will cancel and remove the job. It can also be used to clear completed or failed jobs from the Job Queue. |
Dataset Job More Info and Logs
Users can get more information about the status of a job by looking at the More Info section that is hidden using the dropdown icon shown below.
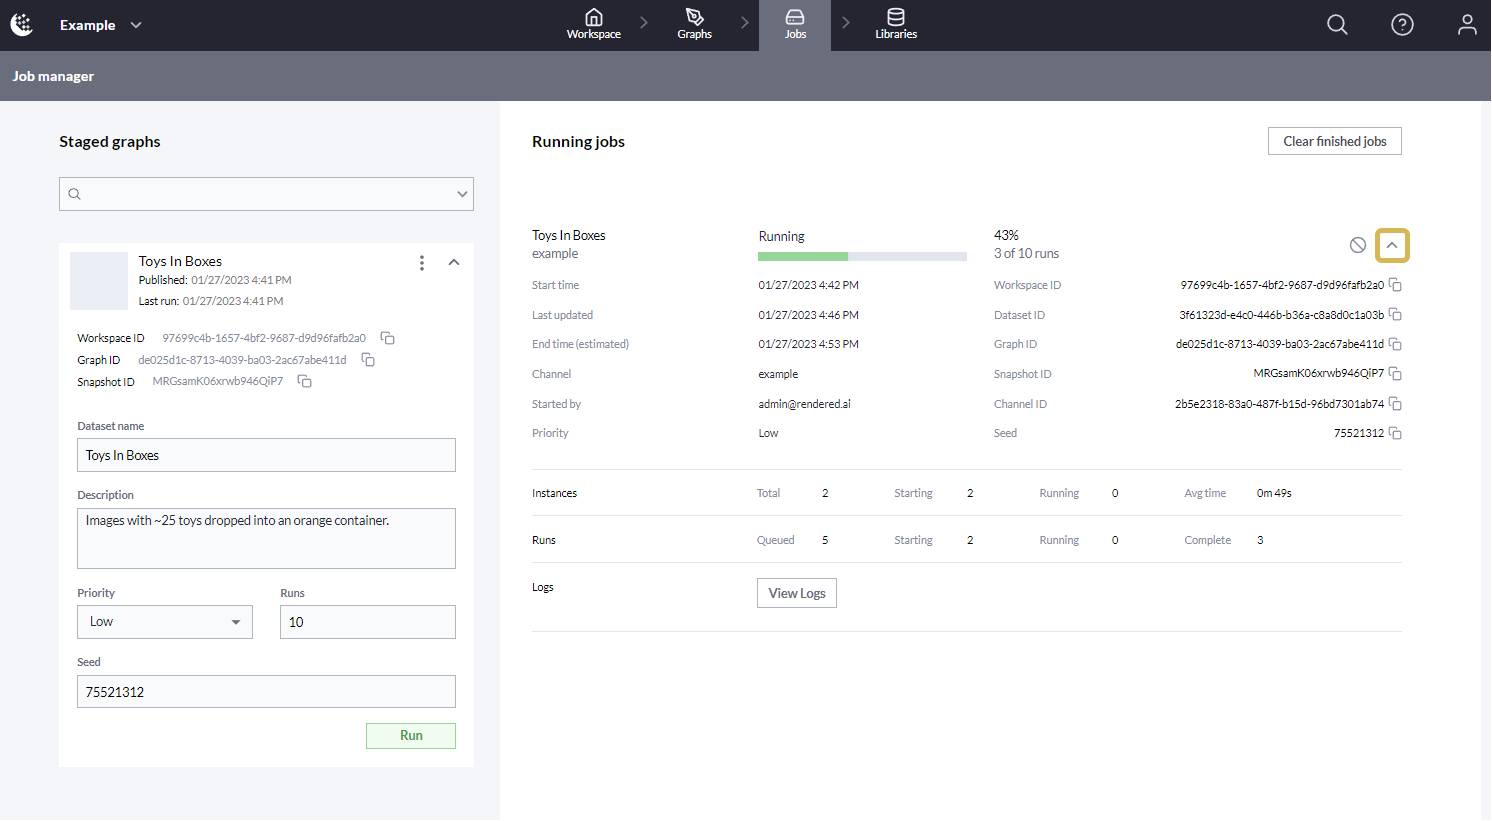
Dataset Job More Info
The More Info section shares a few details about the Graph and Channel used to create the dataset, the User who kicked off the job and estimates around completion time. The More Info section also has details about the state of both Runs and Instances used to complete the job.
Clicking the View Logs button will bring up the Logs Manager. From here we can view the logs for runs of a Dataset Job that are either running or have already completed or failed.
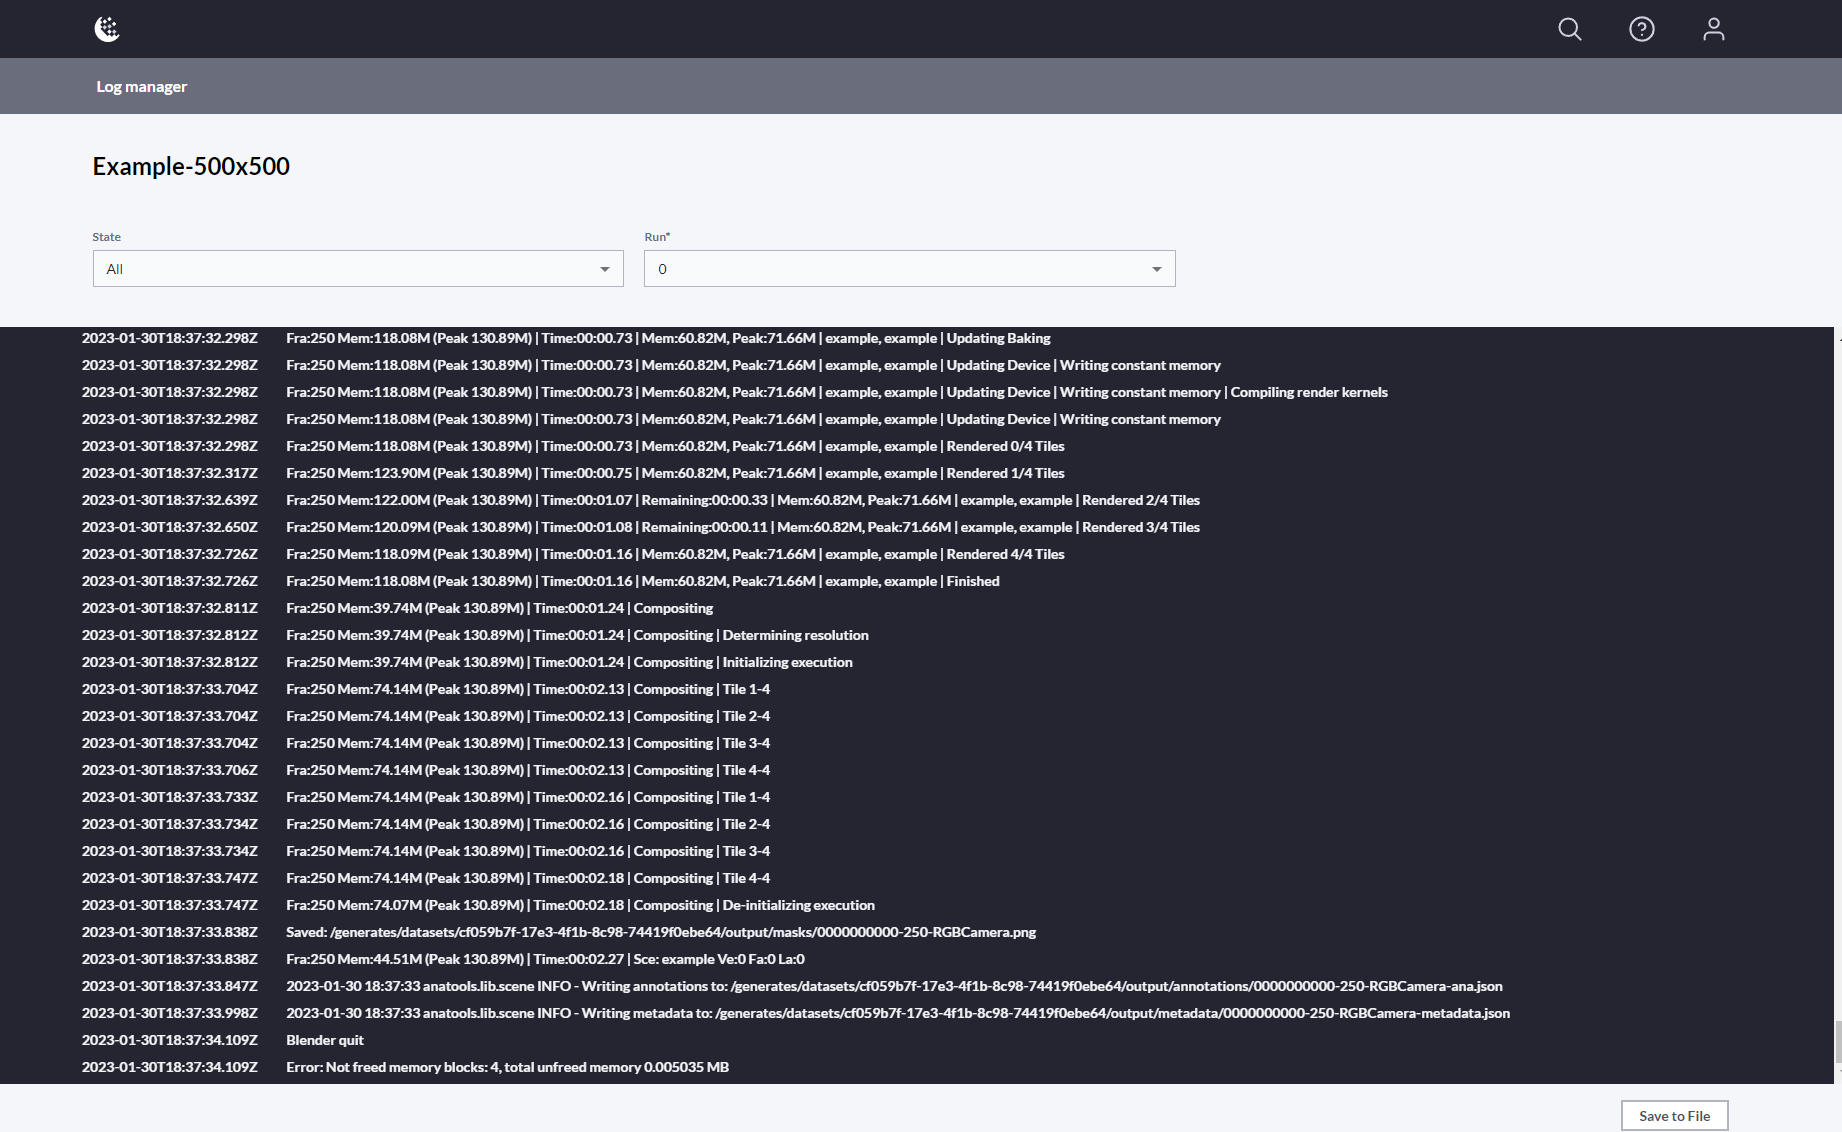
Log Manager
We can specify a Run State or Run Number to filter by. These dataset logs can help us identify issues with failed runs and either fix the graph or channel code base. The logs can also be saved in a text file format for easier viewing or reporting.